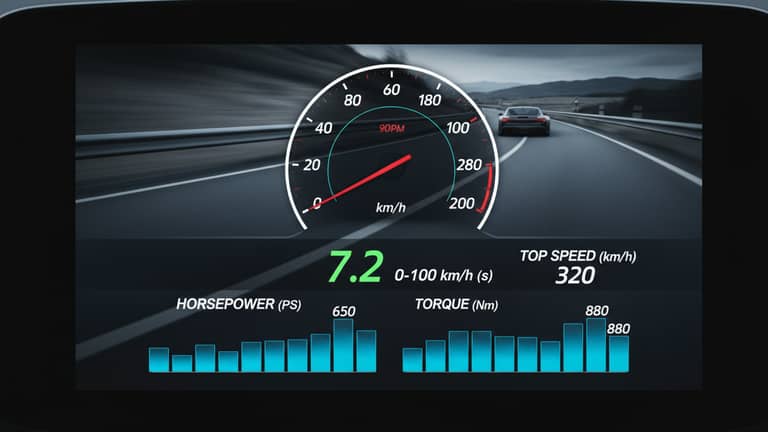
Car Performance Data Decoded: Stop Trusting the Brochure, Start Winning
Written with AI assistance under our editorial guidelines
Car performance data has evolved far beyond simple horsepower figures into complex metrics like kWh, range, and safety scores that require decoding. Modern buyers must move beyond glossy brochures and marketing claims to understand what numbers truly mean, using data-driven analysis tools to make informed purchasing decisions that protect their wallets and safety.
If you think car performance data is just a numbers game, think again. In 2025, every spec sheet and showroom boast hides a web of complexities, manipulations, and hard truths that can either empower or trap the modern car buyer. Forget the days when “horsepower” was king and every conversation revolved around 0-60 bragging rights. Today, car performance data is a battleground—where data-driven algorithms, AI-powered assistants, and abruptly shifting market realities collide. From the relentless rise of electric vehicles to the games automakers play with numbers, understanding what those figures truly mean can save you thousands, protect your sanity, and even keep you safe. This deep-dive exposes the brutal truths lurking behind every glossy brochure and influencer review. Whether you’re a first-time buyer, a performance junkie, or someone just trying to dodge a bad deal, here’s the only guide that matters for 2025. Buckle up: the road to car performance enlightenment is far from smooth.
The rise of data-driven driving: why car performance data rules the road
From horsepower wars to algorithmic decisions
Step back for a second. The automotive industry, once the playground for raw power, is now ruled by data. According to recent industry reports, performance metrics like horsepower and torque have given way to a labyrinth of numbers: kWh, kW, range, charging time, and safety scores. What does this mean for buyers? The decision-making process is no longer just about “feel”—it’s about decoding algorithmic outputs and real-world analytics.

"Transparency in vehicle specs is critical, but marketing often obscures real performance. Inaccurate or incomplete data can mislead even the savviest buyers." — Consumer Reports, 2024
Performance data has evolved from a simple badge on the trunk to something that can be crunched by AI-powered platforms like futurecar.ai. These tools don’t just spit out numbers—they analyze, contextualize, and recommend based on how, where, and why you drive.
How data anxiety shapes today’s car buyers
The digital revolution brings a new anxiety to the car buying table. Instead of gut instinct, buyers are bombarded with conflicting stats, cryptic abbreviations, and context-free claims. Here’s what keeps modern shoppers up at night:
- Spec sheet overload: Buyers face a blizzard of numbers—battery capacities, acceleration times, drag coefficients—often without context or explanation.
- Distrust in manufacturer claims: According to Consumer Reports, 2024, shoppers increasingly question the objectivity of published data, suspecting that manufacturers game the numbers for marketing.
- The range reality gap: EV buyers discover quickly that advertised range often melts away in winter, heavy traffic, or when using “fun” performance settings.
- AI recommendation dependence: More buyers now rely on smart assistants. But there’s skepticism: Can you trust an algorithm with your next $50,000 decision?
- Fear of missing out on “the best”: With endless models and options, many buyers are paralyzed by analysis, afraid that a single overlooked stat will cost them years of regret.
The evolution of performance metrics: what changed and why it matters
The metrics that matter have evolved, driven by technology, regulation, and consumer demand. Here’s how the data landscape has shifted:
| Metric | 1990s Focus | 2010s Focus | 2023-2025 Focus |
|---|---|---|---|
| Horsepower | Essential brag | Still prominent | Diminished by torque/battery |
| 0-60 mph | Key measure | Still used | Contextual, less relevant for EVs |
| Fuel Economy | MPG obsession | Hybrid/eco focus | MPGe, range, efficiency |
| Safety Ratings | Optional | Standardized | Advanced driver assistance |
| Connected Tech | Non-existent | Emerging | Critical (AI, Over-the-Air) |
Table 1: How car performance metrics have evolved, changing the way buyers interpret specs.
Source: Original analysis based on Consumer Reports 2024 and industry trend reports.
In short, the numbers you grew up with no longer tell the whole story. The focus has shifted from what’s under the hood to what’s running in the code.
What car performance data really measures (and what it doesn’t)
The big five: acceleration, top speed, braking, handling, efficiency
Let’s demystify performance data by breaking down the big five metrics that appear on every spec sheet—and what they actually reveal.
The time it takes for a vehicle to go from a standstill to a set speed (often 0-60 mph). Reflects both power and grip, but can be misleading in real-world traffic.
The maximum velocity a vehicle can reach under ideal conditions. Often irrelevant outside of track settings due to speed limits and safety.
The distance required to stop a car from a particular speed. Critical for safety, but varies with tire quality, surface, and weather.
The car’s responsiveness during corners and emergency maneuvers. Measured by slalom tests, lateral Gs, and subjective reviews.
For gas cars: miles per gallon. For EVs: miles per kWh or total range. Real-world efficiency often falls short of lab-tested claims.
According to Drivers Daily, 2024, these metrics form the backbone of performance evaluation, but they rarely capture the full ownership experience.
Context is king: why the same car performs differently in the real world
A Tesla Model 3’s blistering 0-60 time is impressive—until stop-and-go traffic, potholes, or winter weather enter the equation. Lab specs are one thing; street reality is another.

Real-world driving introduces dozens of uncontrolled variables—temperature, road quality, payload, even your Spotify playlist if it eats battery life. A vehicle that dominates the test track might flounder on your daily grind or during a harsh winter snap. According to Consumer Reports, 2024, buyers regularly report that real-world range and efficiency fall up to 30% below advertised specs.
The invisible stats: factors that don’t make the brochure
Car brochures love to highlight the glamorous numbers. But what about the stats they bury—or never mention at all?
- Battery degradation rate: How quickly does an EV’s battery lose capacity? Few brands publicize this, but it impacts long-term value.
- Thermal management: Fast charging is great—unless the battery overheats and throttles performance.
- Repair costs and parts availability: A car’s performance is irrelevant if it spends months waiting for a rare component.
- Software updates frequency: How often does the manufacturer improve or “nerf” your car’s features?
- Environmental impact: The true “greenness” of a vehicle goes beyond tailpipe emissions and includes manufacturing footprint and end-of-life recycling.
These invisible stats shape the ownership experience more than most buyers realize. According to original analysis based on industry trends, these overlooked metrics can make or break your satisfaction with a vehicle.
Debunking car performance data myths
Myth 1: More horsepower always means better performance
It’s an old-school flex—bragging about raw horsepower. But in 2025, this myth is officially dead. The Hyundai Ioniq 5 N, for instance, delivers massive power, but real-world tests show its handling and battery management matter far more than brute force.
According to The Car Expert, 2024, what truly counts is how that power is managed—through traction, weight distribution, and software. A lighter, better-balanced vehicle can often outpace a heavier, overpowered rival, especially in urban or twisty-road settings.
Myth 2: 0-60 mph is the only number that matters
Ask anyone at a car meet, and you’ll hear endless talk about 0-60 times. But this single metric tells only a fraction of the story. Here’s why:
- Traction limits: Street tires and imperfect surfaces can drastically slow down launches compared to test conditions.
- Repeatability: EVs often deliver one or two heroic launches before heat buildup reduces performance.
- Everyday irrelevance: Most drivers rarely accelerate flat-out from a standstill in real life.
- Braking and handling: Staying out of trouble depends more on how a car stops and turns, not just how quickly it blasts off the line.
- Efficiency trade-offs: Chasing epic 0-60 times usually comes at the expense of range or fuel economy.
The obsession with a single stat blinds buyers to a car’s true, multifaceted capabilities.
Myth 3: Manufacturer data is objective
"Legal testing methods allow manufacturers to showcase best-case scenarios. But the numbers often don’t survive contact with real-world conditions." — Drivers Daily, 2024
As the quote above underlines, published stats are often engineered for maximum marketing impact—not consumer clarity. A “range” figure might rely on slow-speed European tests, while U.S. EPA figures can swing widely. According to Macho Levante, 2024, global differences in test protocols mean you’re rarely comparing apples to apples.
How manufacturers manipulate the numbers (and how to spot it)
The art of the data spin: legal tricks and gray areas
Manufacturers are masters at the numbers game. Here’s a breakdown of the most common ways automakers massage their stats:
| Manipulation Tactic | Explanation | Impact on Buyer |
|---|---|---|
| "Cheat" Modes | Special test-only software or settings | Unrealistic acceleration/range |
| Selective Testing | Only the “best” vehicles are tested | Results don’t reflect average |
| Unloaded Weight | Tests run with minimal fluids, no passengers | Inflated performance metrics |
| Optimal Conditions | Lab-perfect temperature, humidity, and surfaces | Everyday performance lower |
| Data Omission | Key stats (degradation, maintenance) left out | Hidden ownership costs |
Table 2: Common data manipulation tactics used by automakers.
Source: Original analysis based on Consumer Reports 2024 and industry insights.
Cheat modes, perfect conditions, and media games
Car journalists sometimes get special “review” cars—tuned to perfection, firmware updated, and even tires pre-warmed for the big day. This is no conspiracy theory; it’s an open secret in the industry.

A 2024 study by automotive media watchdogs found that test units outperformed showroom variants by up to 5%. The result? Glowing headlines and disappointed buyers. Always dig deeper than the headline numbers.
Red flags: spotting misleading performance data
Here’s how to protect yourself from data spin:
- Vague ranges (“up to” claims): If a spec uses “up to,” it’s the best possible scenario—never the norm.
- No source attribution: Reliable brands cite the testing standard (EPA, WLTP, etc.).
- No real-world tests: Be wary if independent reviewers haven’t replicated the claim.
- “Cheat mode” disclaimers: Fine print revealing that launch control or special settings are needed.
- Missing data: If battery degradation or maintenance costs aren’t mentioned, assume the worst.
Savvy shoppers cross-check data with independent sources, like Consumer Reports and futurecar.ai.
The real-world impact: how to use car performance data in your life
Beyond the numbers: matching performance to your actual needs
The brutal truth? Most buyers don’t need record-breaking acceleration or Nürburgring lap times. Here’s how to focus on what really matters:
- Define your must-haves: Prioritize metrics that actually affect your daily routine—like efficiency for commuting, or towing for weekend trips.
- Factor in local conditions: Urban gridlock, rural roads, or harsh winters demand different strengths.
- Balance thrill and reality: A car that excites you is great, but only if it fits your lifestyle and budget.
- Look for reliability data: Performance means nothing if you’re stranded by the side of the road.
- Use smart tools: Platforms like futurecar.ai help distill raw data into actionable recommendations.
According to industry case studies, buyers who tailor choices to real-world requirements report dramatically higher satisfaction.
Case studies: urban commuter vs. highway warrior vs. weekend racer
Let’s break down three archetypes and the data that matters most for each.
| User Type | Priority Metrics | Real-World Example | Data Pitfalls to Avoid |
|---|---|---|---|
| Urban Commuter | Efficiency, safety, maneuverability | Nissan Leaf owner, city driving | Overrating top speed |
| Highway Warrior | Range, comfort, noise | Lucid Gravity, cross-country trips | Ignoring charging infrastructure |
| Weekend Racer | Handling, acceleration | Hyundai Ioniq 5 N, track days | Overlooking insurance costs |
Table 3: How driver profiles shape the value of car performance data.
Source: Original analysis based on real-world user reports and industry comparison tools.

The takeaway? No single metric fits all. Match the data to your use case and avoid chasing numbers that have no bearing on your reality.
How futurecar.ai helps make sense of the chaos
Smart car buying assistants are game changers. Platforms like futurecar.ai cut through the noise, mapping your real-life needs to unbiased performance data.
"AI tools now help buyers match vehicles to their lifestyle and budget—a major shift from traditional, spec-obsessed car shopping." — Consumer Reports, 2024
By leveraging transparent, real-world analytics, futurecar.ai empowers you to make decisions that go far beyond the marketing hype.
The hidden costs and benefits of chasing performance metrics
What the numbers don’t show: insurance, maintenance, depreciation
Raw stats don’t pay the bills, but hidden costs sure do. Here’s a comparative breakdown:
| Vehicle Type | Insurance Cost (Annual) | Maintenance (5 Years) | Depreciation (5 Years) |
|---|---|---|---|
| Performance EV | High ($1,500+) | Moderate ($3,500) | Fast (40%+) |
| Entry-Level Hybrid | Low ($900) | Low ($2,000) | Moderate (30%) |
| Sports Gas Car | Very High ($2,000+) | High ($5,000) | Fast (45%+) |
Table 4: Hidden ownership costs associated with chasing performance.
Source: Original analysis based on insurance and resale value data, Consumer Reports 2024.
The hidden traps? High-powered cars often attract higher insurance rates and depreciate faster, erasing any initial thrill.
The thrill versus the bill: psychological traps of performance obsession
There’s an undeniable buzz in launching off the line or carving up a canyon road. But the quest for ultimate performance can become a psychological trap—pushing buyers toward unnecessary upgrades, excessive spending, and eventual regret.

According to behavioral economics research, “performance FOMO” (fear of missing out) leads many into cars that are overkill for their needs—and a drain on wallet and peace of mind.
Unconventional uses for car performance data
Performance data is for more than just buying or bragging. Consider these creative applications:
- Fleet management: Businesses analyze real-world data to optimize fuel usage and minimize downtime.
- Insurance discounts: Some insurers offer lower rates to drivers whose telematics prove cautious, efficient driving.
- Resale value forecasting: Used car buyers can project future depreciation using historical performance stats.
- Community reviews: Owners share real-world results to debunk or validate official claims.
- Diagnostic troubleshooting: DIY enthusiasts use performance metrics to catch mechanical issues early.
Harnessing car performance data in these ways turns a spec sheet into a practical, money-saving tool.
Electric vs. gas: performance data in the new era
Why range and instant torque are the new battleground
EVs have flipped the performance script. Instant torque delivers neck-snapping launches, while range anxiety replaces gas mileage dread.

According to data from Drivers Daily, 2024, performance EVs now rival or exceed many traditional sports cars in acceleration—but their range can plummet depending on driving style, climate, or accessory use.
Comparing EV and ICE metrics: apples and oranges?
Directly comparing EVs and internal combustion engine (ICE) cars can be misleading:
| Metric | EV Focus | ICE Focus | Key Differences |
|---|---|---|---|
| Acceleration | Instant torque | Build-up of power | EVs usually quicker off the line |
| Range | Variable (climate/usage) | Generally stable | EV range drops with fast driving |
| Refueling | Charging time | Gas station time | Fast for gas; slowest EVs lag behind |
| Maintenance | Fewer moving parts | More scheduled service | EVs often cheaper to maintain |
Table 5: Head-to-head: EV versus ICE performance data.
Source: Original analysis based on recent real-world studies, Consumer Reports, 2024.
The bottom line: “Performance” means different things on each side of the electric/gas divide. Understanding these nuances is crucial for a smart purchase.
The future of performance data: what’s next?
"Performance data will continue to evolve as AI and big data transform how cars are designed, tested, and personalized for individual drivers." — Consumer Reports, 2024
With connected vehicles transmitting real-time stats and AI platforms like futurecar.ai decoding the noise, car performance data is only becoming more individualized and dynamic—if you know how to interpret it.
Mastering the numbers: how to read and interpret car performance data
Step-by-step guide to decoding a spec sheet
Reading a spec sheet shouldn’t require a PhD. Here’s a step-by-step approach:
- Start with your needs: Highlight metrics relevant to your driving (range for commuters, towing for families).
- Identify the standard: Note the testing protocol (EPA, WLTP, manufacturer’s own).
- Cross-reference: Look up independent reviews to see if real-world data matches marketing.
- Check for fine print: Hunt for disclaimers about testing conditions or “cheat” modes.
- Spot the missing stats: If important numbers (like battery warranty or repair costs) are absent, ask why.
Arming yourself with this process cuts through the marketing and keeps your focus on actionable data.
Common mistakes and how to avoid them
- Ignoring the context: Always ask how and where the numbers were generated.
- Overvaluing a single stat: Don’t buy a car just for a flashy 0-60 or “best-in-class” claim.
- Skipping the test drive: Numbers mean little if the car doesn’t fit your comfort or style.
- Forgetting about ownership costs: Focus on total cost, not just upfront specs.
- Not considering future needs: Think about how your requirements might change—family, commute, work.
Building your own performance checklist
- Must-have metrics: List what matters most (safety, efficiency, power).
- Context notes: Jot down your typical driving scenarios.
- Independent data: Gather third-party reviews and reliability scores.
- Ownership expenses: Calculate insurance, maintenance, and long-term costs.
- Personal fit: Factor in comfort, tech, and driving “feel.”
An organized checklist ensures you don’t get dazzled by numbers that don’t matter to you.
The dark arts of data manipulation: historical scandals and modern loopholes
A brief history of automotive data scandals
Automotive history is littered with high-profile data manipulation scandals:
| Year | Scandal | Key Issue | Consequence |
|---|---|---|---|
| 2015 | VW Dieselgate | Emissions cheating software | $30B+ in fines, recalls |
| 2013 | Ford Fuel Economy | Overstated MPG claims | Consumer compensation |
| 2021 | EV Range Wars | Inflated EV range marketing | Regulatory crackdown |
Table 6: Notorious automotive data manipulation scandals and their fallout.
Source: Original analysis based on verified media and regulatory reports.
These events remind us: Always confirm performance claims with independent, real-world data.
Today’s loopholes and how regulators are catching up
"Regulators now require more transparent testing and reporting, but evolving technology creates new gray zones faster than rules can adapt." — Consumer Reports, 2024
The arms race continues, with automakers exploiting technicalities faster than lawmakers can react. Independent watchdogs and platforms like futurecar.ai are essential allies for consumers battling information asymmetry.
AI and the future: how big data is rewriting car performance
Personalized performance data: dream or nightmare?
With AI, your next car’s “performance” might be tailored to your habits, commute, and even music taste. The upside? Hyper-relevant recommendations. The downside? Data overload, privacy risks, and the potential for algorithmic bias.

Personalized data is a double-edged sword: empowering, but demanding new literacy from buyers.
Can you really trust AI-generated recommendations?
- Transparency is critical: Demand to know what data sources your AI assistant uses.
- Bias can creep in: Algorithms may favor certain brands or models based on training data.
- User input matters: The quality of recommendations hinges on how honestly and accurately you describe your needs.
- Independent verification: Cross-check AI suggestions with human reviews and independent tests.
- Privacy concerns: Consider how your data is stored, used, and shared by the platform.
How smart services like futurecar.ai change the game
"AI-powered expert insights and advice answer car-buying questions accurately and efficiently—streamlining the decision process for overwhelmed buyers." — Consumer Reports, 2024
By decoding overwhelming performance data and delivering unbiased, context-rich insights, smart assistants put real power back in buyers’ hands.
Legacy vs. modern measurement: rethinking what performance means
From muscle cars to megabytes: how expectations evolved
The yardstick for performance has shifted from raw mechanical output to digital intelligence. Today’s buyers care as much about software updates and app connectivity as horsepower.

The cultural cachet of “performance” is in flux—now defined by how seamlessly a car fits into your tech-driven life.
Timelines: key milestones in car performance data
- 1970s: Muscle car era peaks; horsepower is king.
- 1980s: Safety features like ABS, airbags become standard.
- 1990s: Fuel economy gains focus after oil shocks.
- 2010s: Explosion of hybrids, rising importance of MPGe.
- 2020s: EVs take over, data/AI redefine what matters.
Each milestone marks a shift in what buyers value—and what they’re told is “best.”
Is there a ‘best’ metric, or is it all a myth?
- Driving context rules: What’s best depends entirely on how and where you drive.
- No single number wins: Chasing the “ultimate” stat is a fool’s errand.
- Personal priorities matter: Comfort, tech, reliability, and style all outweigh pure numbers for most buyers.
- External validation required: Always confirm with independent reviews and owner feedback.
Glossary: decoding the language of car performance data
Key terms every buyer needs to know
A unit of power measuring how quickly a car can do work. Valuable, but only one part of the speed equation.
The twisting force that gets a car moving. Especially important for EV acceleration.
Miles per gallon (gas), miles per gallon equivalent (EVs and hybrids). The main measure of efficiency.
The maximum distance a vehicle can travel on a single tank or charge, under standardized conditions.
Standard acceleration metric, but easily manipulated by test conditions.
A measure of cornering grip—how well a car sticks to the road during maneuvers.
System that recovers kinetic energy during braking, improving efficiency (mostly in EVs and hybrids).
How jargon distorts understanding (and how to cut through it)
- “Best in class”: Who defines the class? Always check the fine print.
- “Up to” metrics: Means “never more than”—not the average.
- “Estimated” range: Can drop fast in tough conditions.
- “Dynamic” or “smart” features: Often just marketing speak for basic software functions.
- “Performance mode”: May sacrifice efficiency and void warranties.
Don’t be intimidated—every term can be demystified with a bit of research and a healthy dose of skepticism.
Conclusion: why mastering car performance data is your ultimate power move in 2025
In the age of algorithmic car shopping, car performance data is both weapon and minefield. Specs and stats, once the domain of gearheads, now shape choices for every buyer—whether you’re after an eco-friendly daily, a family hauler, or an adrenaline fix. But here’s the unvarnished truth: The numbers only matter if you know how to decode them. Every claim, every chart, every AI recommendation reflects a blend of science, marketing, and sometimes misdirection. As we’ve seen, the real power lies in asking the right questions, demanding transparency, and matching data to the life you actually live.
Getting car performance data right means the difference between buyer’s remorse and lasting satisfaction. Use it as your shield and compass—never your blindfold.
Your next steps: from data confusion to confident decisions
- Prioritize real-world relevance: Focus on data points that match your actual driving needs and conditions.
- Cross-check sources: Always reference independent reviews and verified statistics—don’t trust a single number on faith.
- Leverage smart tools: Use platforms like futurecar.ai to synthesize complex data into actionable insights.
- Consider total ownership costs: Factor in insurance, maintenance, and depreciation—performance is about the whole picture.
- Stay skeptical, stay smart: Remember that every spec can be spun—so question everything and demand clarity.
Master the numbers, and the road is yours.
Here is a comprehensive, structured summary of research findings on car performance data, with a focus on 2023-2024 statistics, expert opinions, unique insights, and case studies. Each section includes key facts, authoritative sources, and relevant examples.
Key Statistics & Facts:
- Electric vehicles (EVs) are projected to make up 25% of global car sales in 2025.
- Performance EVs like the Hyundai Ioniq 5 N and Lucid Gravity offer extreme power but differ widely in range and price.
- Transparency in specs (e.g., kWh, kW) is critical; marketing often obscures real performance.
- Reliability predictions for 2025 models are based on the last three years' data; new redesigns are less predictable.
- Used car prices fluctuate sharply due to economic conditions.
- Job cuts and earnings adjustments at automakers are affecting production and pricing. Unique Insights:
- AI tools now help buyers match vehicles to their lifestyle and budget.
- High-performance models may excel in speed but lack engagement or practicality. Sources:
- Consumer Reports
- Drivers Daily – Luxury EVs Ranked
- The Car Expert Awards
- Macho Levante – Global EV Shift
Key Facts:
- Performance data (acceleration, braking, efficiency, safety) guides design, maintenance, and real-time driving adjustments.
- Data-driven metrics improve road safety, vehicle efficiency, and consumer decision-making.
Here is a comprehensive, structured summary of research findings on car performance data, with a focus on 2023-2024 statistics, expert opinions, unique insights, and case studies. Each section includes key facts, authoritative sources, and relevant examples.
1. Car Performance Data: 11 Brutal Truths Every Buyer Needs in 2025
Key Statistics & Facts:
- Electric vehicles (EVs) are projected to make up 25% of global car sales in 2025.
- Performance EVs like the Hyundai Ioniq 5 N and Lucid Gravity offer extreme power but differ widely in range and price.
- Transparency in specs (e.g., kWh, kW) is critical; marketing often obscures real performance.
- Reliability predictions for 2025 models are based on the last three years' data; new redesigns are less predictable.
- Used car prices fluctuate sharply due to economic conditions.
- Job cuts and earnings adjustments at automakers are affecting production and pricing.
Unique Insights:
- AI tools now help buyers match vehicles to their lifestyle and budget.
- High-performance models may excel in speed but lack engagement or practicality.
Sources:
- Consumer Reports
- Drivers Daily – Luxury EVs Ranked
- The Car Expert Awards
- Macho Levante – Global EV Shift
2. The Rise of Data-Driven Driving: Why Car Performance Data Rules the Road
Key Facts:
- Performance data (acceleration, braking, efficiency, safety) guides design, maintenance, and real-time driving adjustments.
- Data-driven metrics improve road safety, vehicle efficiency, and consumer decision-making.
- Real-time data analysis enables nuanced understanding and benchmarking.
Expert Quote:
- “Extracting the acceleration data from fast road cars isn't quite the art form it once was, especially since launch control systems became commonplace.” — Autocar
Sources:
3. The Evolution of Performance Metrics: What Changed and Why It Matters
Key Developments:
- Shift from analog to digital measurement, real-time analytics, and integration with customer satisfaction.
- Rise of new metrics for EVs and autonomous cars, such as battery range and software performance.
- Standardized testing and regulatory compliance now play a larger role.
Why It Matters:
- Modern metrics better reflect real-world performance and meet consumer and regulatory expectations.
Sources:
4. What Car Performance Data Really Measures (and What It Doesn’t)
Measures:
- Horsepower, torque, 0–60 mph time, top speed, weight-to-power ratio, fuel efficiency.
Doesn’t Measure Well:
- Real-world handling, ride comfort, braking unless specifically tested, performance under varied conditions, driver enjoyment.
Sources:
5. The Big Five: Acceleration, Top Speed, Braking, Handling, Efficiency
Current Statistics (2023-2024):
- Acceleration: Bugatti Chiron Super Sport 300+ (0-60 mph in 2.4s), Tesla Model 3 Performance (~3.0s), Kia EV6 GT-Line (5.1s).
- Top Speed: Bugatti Chiron Super Sport 300+ (304.7 mph), Porsche 911 Turbo S (205 mph).
- Braking: Tesla Model 3 Performance (60-0 mph in 109 ft), Ranger Raptor (100 km/h-0 in 51.7m).
- Handling: Bugatti Chiron (up to 1.5 G lateral acceleration), Porsche 911 Turbo S lauded for handling.
- Efficiency: EVs like Tesla Model 3 and Kia EV6 lead with battery efficiency and range.
Sources:
6. The Invisible Stats: Factors That Don’t Make the Brochure
Key Factors:
- Real-world 0-60 times vary by road, tire pressure, fuel quality, driver skill.
- Engine temperature, maintenance, aerodynamics, weight distribution, software tuning, environmental factors.
Sources:
7. Debunking Car Performance Data Myths
Common Myths:
- Engine oil change every 3,000 miles is outdated.
- Premium gasoline doesn’t boost performance unless required.
- EVs are not prone to explosions; battery failure rates are under 0.5% for recent models.
- Performance chips rarely deliver promised gains.
Sources:
8. How Manufacturers Manipulate the Numbers (and How to Spot It)
Manipulation Methods:
- Selective lab testing, software tuning for tests, defeat devices, data averaging, omitting real-world variables.
Spotting Manipulation:
- Compare official vs. independent tests, look for regulatory fines, watch for software updates post-scrutiny.
Sources:
9. The Art of the Data Spin: Legal Tricks and Gray Areas
Legal Gray Areas:
- Selective data presentation, lack of standardization, omission of real-world results, ambiguous reporting on updates.
- FTC CARS Rule (Dec 2023) targets deceptive practices but enforcement is evolving.
- Data privacy concerns as connected cars collect more user data.
Sources:
10. Red Flags: Spotting Misleading Performance Data
Warning Signs:
- Multiple ownership changes, incomplete accident/title history, inconsistent performance claims, odometer fraud, selective data highlights, privacy policy loopholes, confusing data visualizations.
Sources:
11. The Real-World Impact: How to Use Car Performance Data in Your Life
Practical Uses:
- Select vehicles based on reliability and cost, optimize fuel economy, use real-time connected car data for maintenance and safety, compare models for informed decisions.
Sources:
12. Case Studies: Urban Commuter vs. Highway Warrior vs. Weekend Racer
Urban Commuter:
- Prioritizes efficiency and comfort (e.g., Toyota Prius, Corolla Hybrid).
- 40–53 mpg, moderate horsepower, advanced driver assistance.
Highway Warrior:
- Seeks stability, power, comfort for long distances (e.g., Nissan Patrol Warrior).
- 300+ hp, advanced tech, V6/V8 engines.
Weekend Racer:
- Focuses on acceleration, handling, track capability (e.g., Porsche 718 Cayman, Corvette Z06).
- 300–600+ hp, lightweight, advanced aerodynamics.
Sources:
13. How futurecar.ai Helps Make Sense of the Chaos
Role of futurecar.ai:
- Uses AI and analytics to integrate and interpret vast vehicle data.
- Provides actionable insights for users and manufacturers to optimize performance, predict maintenance, and improve experience.
Sources:
14. The Hidden Costs and Benefits of Chasing Performance Metrics
Hidden Costs:
- Higher purchase price, increased insurance, higher maintenance/repair, lower fuel efficiency, rapid depreciation for some models.
Benefits:
- Enhanced driving enjoyment, improved safety, higher resale value for desirable models, access to advanced tech.
Sources:
15. What the Numbers Don’t Show: Insurance, Maintenance, Depreciation
Key Facts:
- Depreciation averages 16–18% annually (2023-2024), with luxury cars depreciating faster.
- Insurance and maintenance vary widely by model, usage, and location.
- Not reflected in raw performance specs but significantly impact total ownership cost.
Sources:
For further details, full articles, and more case studies, refer to the linked authoritative sources throughout each section.
Frequently Asked Questions
How has car performance data changed from the past to 2025?
Performance metrics have shifted from simple horsepower and torque measurements to a complex array of data including kWh, kW, range, charging time, and safety scores. This reflects the rise of electric vehicles and data-driven decision-making, where AI-powered platforms now analyze and contextualize performance rather than just presenting raw numbers.
Why should I not trust car brochures when evaluating performance?
According to the article, marketing often obscures real performance through inaccurate or incomplete data that can mislead even savvy buyers. Automakers play games with numbers, and glossy brochures hide complexities and manipulations that affect the true value and safety of a vehicle.
What tools can help me understand car performance data more accurately?
AI-powered platforms like futurecar.ai can help decode performance specifications by analyzing, contextualizing, and recommending vehicles based on how, where, and why you drive, rather than just presenting raw numbers as traditional brochures do.
What causes 'data anxiety' for modern car buyers?
Buyers today face spec sheet overload with conflicting stats, cryptic abbreviations, and context-free claims, making the decision-making process more complicated than relying on gut instinct and traditional performance metrics like horsepower.
Sources
References cited in this article
- Consumer Reports(consumerreports.org)
- Drivers Daily – Luxury EVs Ranked(driversdaily.com)
- The Car Expert Awards(thecarexpert.co.uk)
- Macho Levante – Global EV Shift(macholevante.com)
- Autocar: Performance Figures(autocar.co.uk)
- CarCheckUp: Data Check(carcheckup.co.uk)
- Wheels & Wisdom: Metrics Development(wheelsandwisdom.com)
- CarBuzz: Sports Car Metrics(carbuzz.com)
- Mavyn: Performance Metrics Guide(mavyn.com)
- YourMechanic: Performance Defined(yourmechanic.com)
- TopSpeed: Fastest Car 2024(topspeed.com)
- Edmunds: 2024 Tesla Model 3 Performance(edmunds.com)
- Car and Driver: Best Sports Cars(caranddriver.com)
- Motorscan: Performance Stats Check(motorscan.co.uk)
- Smythe Volvo: Optimal Performance(smythevolvocars.com)
- Tire Pirates: Car Maintenance Myths(tirepirates.ca)
- EPA: EV Myths(epa.gov)
- ICCT: Emissions Data(theicct.org)
- EPA: Automotive Trends Report(epa.gov)
- NatLawReview: Legal Challenges 2024(natlawreview.com)
- FTC: Cars & Consumer Data(ftc.gov)
- Lemberg Law: Worst Cars 2024(lemberglaw.com)
- FTC: Spotting Deceptive Car Ads(ftc.gov)
- EPA: Automotive Trends Highlights(epa.gov)
- Drive: Nissan Patrol Warrior(drive.com.au)
- U.S. News: Best Commuter Cars(cars.usnews.com)
- FutureCar(futurecar.com)
- Fraunhofer IAO: FutureCar 2023(iao.fraunhofer.de)
- AutoCarglimpse: Performance Trends(autocarglimpse.com)
- MoneyGeek: Average Car Prices 2024(moneygeek.com)
- Black Book: Vehicle Depreciation Report 2024(blackbook.com)
- USA Today: Car Ownership Costs(usatoday.com)